RE+ 2026 · Nov 16–19 · Las Vegas

See what replacing your entire software stack looks like — Booth W15826.

Book a booth demo
Battery Analysis

Will the lights stay on? Prove it.

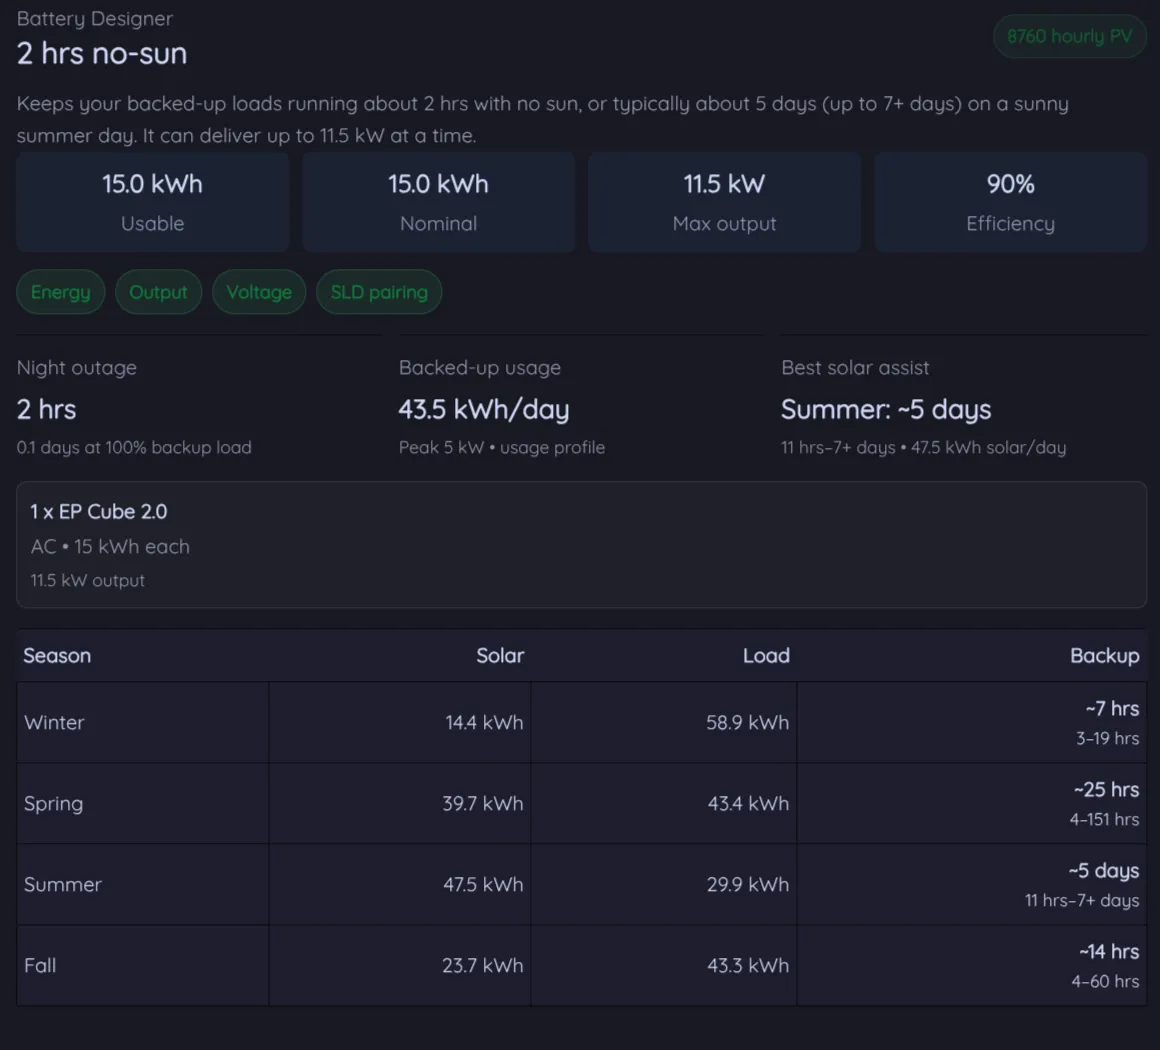
Powerlily simulates your battery bank against 8,760 hours of your design's production and your customer's real usage: worst-case outage duration, seasonal backup ranges, and what the battery earns over 30 years.

powerlily.com / battery
Battery analysis panel with backup duration and storage value
3D design that feeds hourly production into the battery simulation
The Simulation

8,760 hours. Hour by hour.

This isn't a kWh-divided-by-kWh estimate. The battery is simulated through every hour of the year: solar charges it, the home draws it down, charge and discharge limits apply, efficiency losses count.

  • Hourly state of charge against your design's real hourly production
  • Charge and discharge power caps respected, hour by hour
  • Round-trip efficiency weighted across every battery in the bank
  • Falls back gracefully: hourly solar, monthly solar, or load-only when that's all you have
  • A plain-language summary your customer can actually read
Production and backup duration analysis
Backup Duration

Worst case first. Not the sunny-day demo.

Anyone can quote backup hours from a spec sheet. Powerlily sweeps the outage across every possible starting hour and every season, then reports the range, so the number you promise is the number that holds.

  • No-sun outage: the shortest backup duration across every start hour
  • Seasonal backup for winter, spring, summer, and fall, each swept across a 90-day window
  • Min, average, and max reported, never one cherry-picked day
  • Solar-assisted backup modeled: the array recharges the bank mid-outage
  • Warns when peak backed-up load exceeds what the bank can actually output
Customer usage data behind the hourly load model
Load Profiles

Real bills in, real answers out.

The backup story depends on what the home actually draws. Powerlily builds an hourly load model from whatever the customer can give you.

  • Upload interval data for a true 8,760-hour load profile
  • Or shape monthly bills with weekday and weekend usage curves
  • Back up the whole home or just a percentage of it
  • Critical-loads panel support, with warnings when it's oversized for the bank
Battery bank configuration with coupling and readiness checks
AC & DC Coupling

Coupling modeled the way physics works.

Stacking DC batteries behind one hybrid inverter adds energy, not power. AC-coupled units bring their own inverters, so power scales with count. Powerlily gets this right, because your backup promise depends on it.

  • DC-coupled stacks share the hybrid inverter's output limit
  • AC-coupled units scale output with every added battery
  • All-in-one integrated storage recognized automatically
  • Readiness checks: energy, output, voltage window, and SLD pairing
  • Flags DC batteries that are missing a paired hybrid inverter
Time-of-use arbitrage value from battery load shifting
Storage Economics

What the battery earns.

Backup is the story; the bill is the math. When the utility rate has time-of-use periods, Powerlily prices the battery's daily shifting, charge cheap, discharge expensive, and projects it over the system's life.

  • Time-of-use arbitrage from your rate's actual monthly price spreads
  • Cycles per year and kWh shifted per cycle, spelled out
  • 30-year value projection with degradation factored in
  • Self-consumption value when there's no time-of-use rate
Demand charge savings from battery peak shaving
Demand Charges

Peak shaving, priced on the bill.

Demand charges are a separate bill component, dollars per kW of monthly peak, and the battery attacks them separately. Powerlily prices the shaved peak at the utility's actual demand rate and rolls it into the same 30-year total as arbitrage.

  • Peak shaving priced at the utility's rate per kW, month by month
  • Seasonal demand rates imported straight from the published tariff
  • Measured monthly peaks from the customer's bills supersede estimates
  • Demand savings and arbitrage roll into one 30-year projection
Beyond the analysis

The battery flows into the paperwork.

Storage isn't a bolt-on screen. The same battery bank shows up everywhere the project does.

  1. Step 1 Analyze Backup duration, seasonal ranges, and storage value.
  2. Step 2 SLD Battery symbols, backfed breakers, and disconnects drawn in. Learn more
  3. Step 3 Comply 120% busbar checks with Power Control System support. Learn more
  4. Step 4 Plan set Battery datasheets merged into the permit PDF. Learn more
  5. Step 5 Propose Storage in the same branded proposal as production. Learn more
By the numbers

Storage answers with receipts.

8,760 hrs

simulated against your design

4 seasons

each swept across a 90-day window

Worst case

backup swept across every start hour

30 yr

value projection with degradation

Sell storage with receipts.

Simulate the bank against the design in minutes, then send the proposal.